

Делюсь полезным шаблоном для мониторинга сервера HPE Proliant DL580 Gen10. Мониторим по IPMI. Шаблон делал сам.
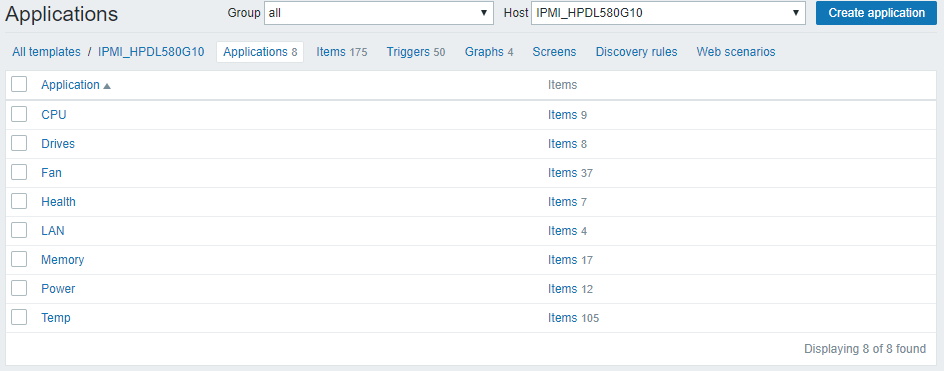
В шаблоне 8 приложений, 175 элементов данных, 50 триггеров и 4 графика.
Скачать шаблон zabbix 3.4: zbx_IPMI_HPDL580G10.xml
Скачать шаблон zabbix 5.0: zbx5_IPMI_HPDL580G10.xml
Value mapping
Administration > General > Value mapping
IPMI Availability Status States
1 ⇒ Device Removed / Device Absent
2 ⇒ Device Inserted / Device Present
IPMI Battery
1 ⇒ Battery low (predictive failure)
2 ⇒ Battery failed
4 ⇒ Battery presence detected
IPMI Drive Slot (Bay)
1 ⇒ Drive Present
2 ⇒ Drive Fault
4 ⇒ Predictive Failure
8 ⇒ Hot Spare
16 ⇒ Consistency Check / Parity Check in progress
32 ⇒ In Critical Array
33 ⇒ Drive Present In Critical Array
35 ⇒ Drive Fault In Critical Array
64 ⇒ In Failed Array
128 ⇒ Rebuild/Remap in progress
256 ⇒ Rebuild/Remap Abortes (was not complete normally)
IPMI LAN
1 ⇒ LAN Heartbeat Lost
2 ⇒ LAN Heartbeat
IPMI Memory
1 ⇒ Correctable ECC
2 ⇒ Uncorrectable ECC
4 ⇒ Parity
8 ⇒ Memory Scrub Failed
16 ⇒ Memory Device Disabled
32 ⇒ Correctable ECC / other correctable memory error logging limit r
64 ⇒ Presence detected
128 ⇒ Configuration error
256 ⇒ Spare
512 ⇒ Memory Automatically Throttled
1024 ⇒ Critical Overtemperature
IPMI OEM LED UID
1 ⇒ On
2 ⇒ Off
4 ⇒ Blink
IPMI Physical Security (Chassis Intrusion)
0 ⇒ OK
1 ⇒ General Chassis Intrusion
2 ⇒ Drive Bay intrusion
4 ⇒ I/O Card area intrusion
8 ⇒ Processor area intrusion
16 ⇒ LAN Leash Lost
32 ⇒ Unauthorized dock
64 ⇒ FAN area intrusion
IPMI Power Supply
0 ⇒ Power supply not installed
1 ⇒ Presence detected
2 ⇒ Failure detected
4 ⇒ Predictive Failure
8 ⇒ Input lost (AC/DC)
16 ⇒ Input lost or out-of-range
32 ⇒ Input out-of-range but present
64 ⇒ Configuration error
128 ⇒ Inactive
IPMI Processor
0 ⇒ Processor not installed
1 ⇒ IERR
2 ⇒ Thermal Trip
4 ⇒ FRB1/BIST failure
8 ⇒ FRB2/Hang in POST failure
16 ⇒ FRB3/Processor Startup/Initialization failure
32 ⇒ Configuration Error
64 ⇒ SM BIOS Uncorrectable CPU-complex Error
128 ⇒ Processor Presence detected
256 ⇒ Processor disabled
512 ⇒ Terminator Presence Detected
1024 ⇒ Processor Automatically Throttled
2048 ⇒ Machine Check Exception Uncorrectable
4096 ⇒ Correctable Machine Check Error
IPMI Redundancy States
1 ⇒ Fully Redundant
2 ⇒ Redundancy Lost
4 ⇒ Redundancy Degraded
8 ⇒ Non-Redundant
16 ⇒ Non-Redundant
32 ⇒ Non-Redundant
64 ⇒ Redundancy Degraded
128 ⇒ Redundancy Degraded
IPMI Severity Event States
1 ⇒ Transition to OK
2 ⇒ Transition to Non-Critical from OK
4 ⇒ Transition to Critical from less severe
8 ⇒ Transition to Non-recoverable from less severe
16 ⇒ Transition to Non-Critical from more severe
32 ⇒ Transition to Critical from Non-recoverable
64 ⇒ Transition to Non-recoverable
128 ⇒ Monitor
256 ⇒ Informational
Приложения
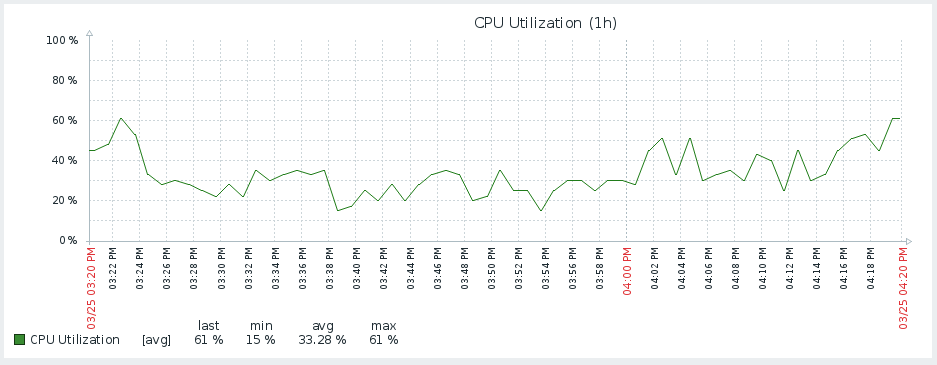
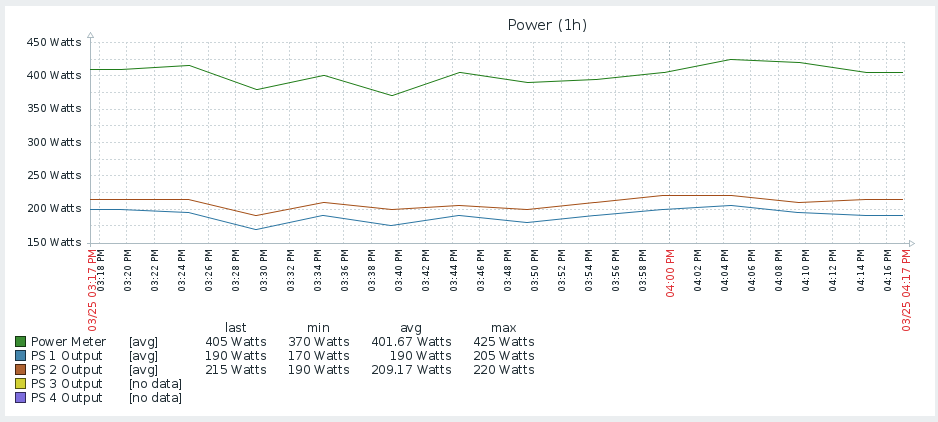
Графики
Power
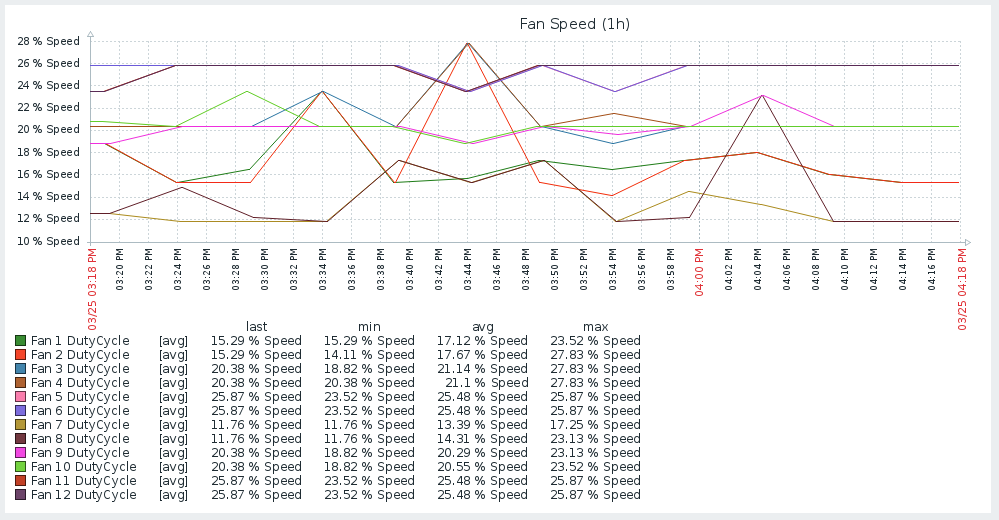
Fan Speed
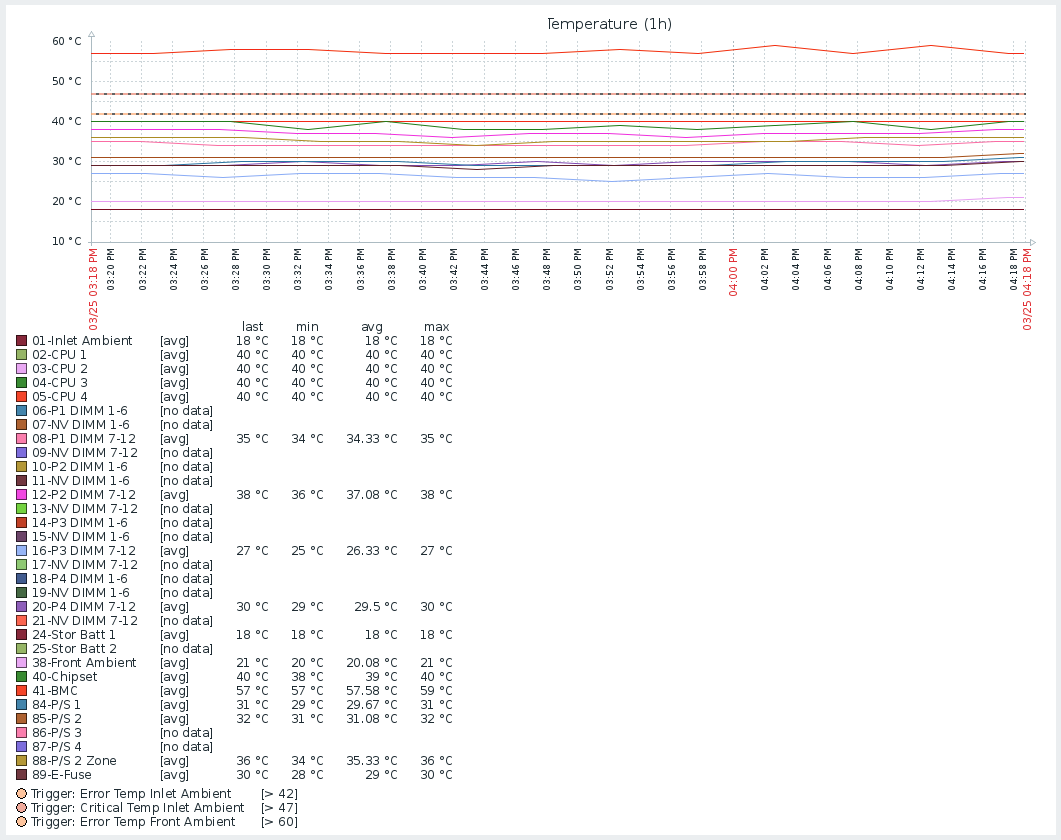
Temperature
CPU Utilization