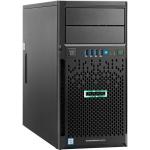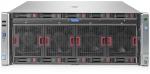

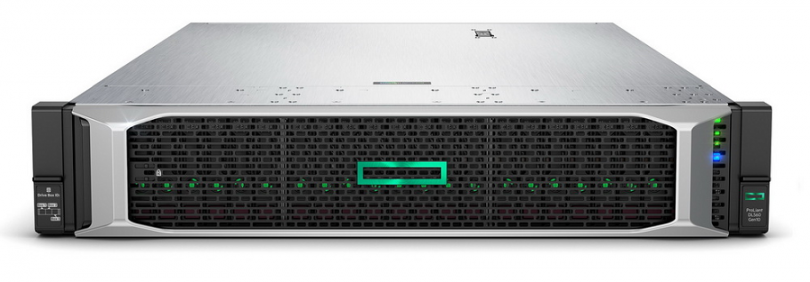
Владимир, один из читателей сайта, прислал Zabbix шаблон для мониторинга сервера HPE ProLiant DL560 Gen10, который он создал на основе одного из моих шаблонов для других моделей серверов. Мониторим по IPMI.
Спасибо, Владимир! Раз уж такое дело, в разделе zabbix выведу список всех доступных шаблонов с указанием авторства.
Шаблон я сам не проверял, у меня такой модели сервера нет, но в XML насчитал: 8 приложений, 171 элемент данных, 45 триггеров и 4 графика.
Скачать шаблон zabbix 3.4: zbx_IPMI_HPDL560G10.xml
Скачать шаблон zabbix 5.0: zbx5_IPMI_HPDL560G10.xml
На всякий случай вам может пригодиться:
Value mapping
В шаблоне они есть.
Administration > General > Value mapping
IPMI Availability Status States
1 ⇒ Device Removed / Device Absent
2 ⇒ Device Inserted / Device Present
IPMI Battery
1 ⇒ Battery low (predictive failure)
2 ⇒ Battery failed
4 ⇒ Battery presence detected
IPMI Drive Slot (Bay)
1 ⇒ Drive Present
2 ⇒ Drive Fault
4 ⇒ Predictive Failure
8 ⇒ Hot Spare
16 ⇒ Consistency Check / Parity Check in progress
32 ⇒ In Critical Array
33 ⇒ Drive Present In Critical Array
35 ⇒ Drive Fault In Critical Array
64 ⇒ In Failed Array
128 ⇒ Rebuild/Remap in progress
256 ⇒ Rebuild/Remap Abortes (was not complete normally)
IPMI LAN
1 ⇒ LAN Heartbeat Lost
2 ⇒ LAN Heartbeat
IPMI Memory
1 ⇒ Correctable ECC
2 ⇒ Uncorrectable ECC
4 ⇒ Parity
8 ⇒ Memory Scrub Failed
16 ⇒ Memory Device Disabled
32 ⇒ Correctable ECC / other correctable memory error logging limit r
64 ⇒ Presence detected
128 ⇒ Configuration error
256 ⇒ Spare
512 ⇒ Memory Automatically Throttled
1024 ⇒ Critical Overtemperature
IPMI OEM LED UID
1 ⇒ On
2 ⇒ Off
4 ⇒ Blink
IPMI Physical Security (Chassis Intrusion)
0 ⇒ OK
1 ⇒ General Chassis Intrusion
2 ⇒ Drive Bay intrusion
4 ⇒ I/O Card area intrusion
8 ⇒ Processor area intrusion
16 ⇒ LAN Leash Lost
32 ⇒ Unauthorized dock
64 ⇒ FAN area intrusion
IPMI Power Supply
0 ⇒ Power supply not installed
1 ⇒ Presence detected
2 ⇒ Failure detected
4 ⇒ Predictive Failure
8 ⇒ Input lost (AC/DC)
16 ⇒ Input lost or out-of-range
32 ⇒ Input out-of-range but present
64 ⇒ Configuration error
128 ⇒ Inactive
IPMI Processor
0 ⇒ Processor not installed
1 ⇒ IERR
2 ⇒ Thermal Trip
4 ⇒ FRB1/BIST failure
8 ⇒ FRB2/Hang in POST failure
16 ⇒ FRB3/Processor Startup/Initialization failure
32 ⇒ Configuration Error
64 ⇒ SM BIOS Uncorrectable CPU-complex Error
128 ⇒ Processor Presence detected
256 ⇒ Processor disabled
512 ⇒ Terminator Presence Detected
1024 ⇒ Processor Automatically Throttled
2048 ⇒ Machine Check Exception Uncorrectable
4096 ⇒ Correctable Machine Check Error
IPMI Redundancy States
1 ⇒ Fully Redundant
2 ⇒ Redundancy Lost
4 ⇒ Redundancy Degraded
8 ⇒ Non-Redundant
16 ⇒ Non-Redundant
32 ⇒ Non-Redundant
64 ⇒ Redundancy Degraded
128 ⇒ Redundancy Degraded
IPMI Severity Event States
1 ⇒ Transition to OK
2 ⇒ Transition to Non-Critical from OK
4 ⇒ Transition to Critical from less severe
8 ⇒ Transition to Non-recoverable from less severe
16 ⇒ Transition to Non-Critical from more severe
32 ⇒ Transition to Critical from Non-recoverable
64 ⇒ Transition to Non-recoverable
128 ⇒ Monitor
256 ⇒ Informational